
The Race Against Time
There is a pervasive story in medicine that physical decline is a straight line starting at age 30. We are told that every year, you get a little slower, a little weaker, and a little less capable.
For the sedentary population, that story is true. For those maintaining a high level of training in their routines, we can blunt this trajectory.
When we look closely at the data on masters athletes who maintain their training volume, the performance trajectory does not look like a slippery slope from 30. It looks like a rectangle.
You will have heard people talking about “squaring the curve” in reference to healthspan versus lifespan; the same is true of your physiology. One study suggests you can maintain a high plateau of performance well into your 60s and 70s, effectively pushing the "ageing cliff" all the way back to your mid-70s.
The physiological stimulus required for training adaptations might increase as we age but training adaptations still occur. Indeed, only recently, I saw someone increase their VO2 peak by 27% over the space of a year. This wasn’t someone starting from scratch. They were already in the elite range for their age at the start of the year.
To understand how to achieve this, we have to look at the difference between your physiology (your engine) and your performance (eg your speed or power). But before we discuss how to keep your performance up, we need to understand why it matters biologically. Your VO2 peak is not just a trophy number or about race times, it is the single most powerful predictor of how long you will live.
The Most Powerful Vital Sign: Why VO2peak Matters
Cardiorespiratory fitness, as measured by VO2 peak, is a more powerful predictor of mortality than traditional risk factors like hypertension, smoking, obesity, and high cholesterol [1].
The gap between the "fit" and the "unfit" is massive. Research shows that low fitness is associated with 5-fold increase in cardiovascular disease or all-cause mortality compared to those with the highest level of fitness [2] . To put that in perspective, having a low VO2 peak carries a mortality risk comparable to or greater than smoking. But this isn’t just a number we use to risk stratify, it is an actionable metric.
The good news is that you don't need to become an Olympian to change your risk profile. The data shows that relatively small improvements in fitness yield massive returns. An improvement of just 1mL/kg/min of VO2 is associated with a 7-13% reduction in all-cause mortality [3]. This is why we care so much about the "engine."
The 1% Rule: The Biology You Can't Out-train
If you look at pure physiological data, there is a clear downward trend as we age, even in Masters-level athletes in whom it is about 1-4% per year [4].
In the general, healthy population, a large study from the FRIEND Registry (Fitness Registry and the Importance of Exercise National Database), analyzed VO2 peak in nearly 8,000 healthy adults [5]. They found that VO2 peak shrinks linearly. The rate of decline across the lifespan is not too dissimilar to the Masters athletes at approximately 10% per decade.
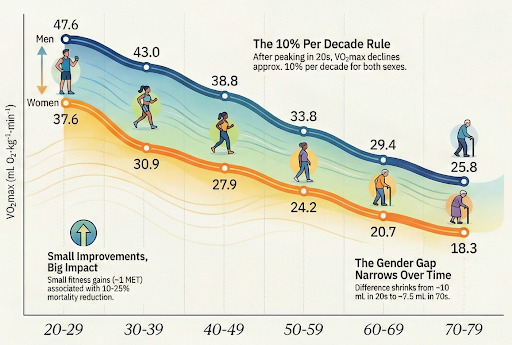
Fig. The reduction in VO2 peak across the lifespan
Crucially, this decline happens even in active populations. The "ceiling" of your engine lowers with age, and you cannot train that away completely.
But performance does not always have to follow this trend.
A separate analysis of elite senior competitors at the National Senior Olympic Games found that race times remained incredibly stable from age 50 to 75 [6]. While the engine might be shrinking by 10% a decade, the car (the athlete) wasn't slowing down at the same rate.
How is this possible?
The answer lies in efficiency and durability. While raw VO2 peak drifts downwards (as shown in the FRIEND data), high-functioning athletes compensate by improving their movement economy and their ability to sustain high percentages of that max, what many of our readers already know as fractional utilisation. You become a more fuel-efficient machine. You might have less raw horsepower than you did at 30, but you waste less energy, allowing you to hold the line on performance long after the "textbook" says you should slow down.
The Evidence: The Curve is Flat, Not Steep
The idea that performance vanishes linearly is a result of looking at average populations who stop moving. When you isolate people who keep training, the picture changes.
1. The "Marathon Plateau" (Ages 50–69)
Large-scale analyses of marathon runners (analyzing nearly 300,000 race results) challenge the linear decline model. For trained runners, performance losses are remarkably absent before age 55, in fact, the mean marathon times for age groups 35 and 45 yo were better than 25 yo [7]. Even more striking: more than 25% of runners aged 60 to 69 finish faster than the average 20-to-50-year-old runners. The average decline in the 50-69 yo group was only 2.6-4.4% per decade.
Biology isn't the primary handbrake in your 50s and 60s; lifestyle is. Those that are able to maintain their activity levels keep the "car" (performance) synchronised with the "engine" (physiology).
2. The 75-Year Inflection Point
Senior Olympic participant data also reflects this inflection point after 70, highlighting that the "cliff edge" is much later than expected. The slope was relatively gradual from age 50 to 75. A dramatic acceleration in performance loss didn't appear until after age 75 [8].
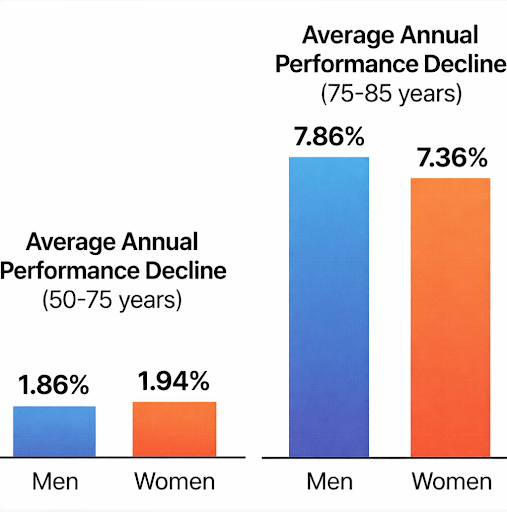
Fig. Performance decline across the years
You have a ~25-year window (50–75) where it is possible to maintain physiology and compensate with efficiency relatively well before the rules of the game fundamentally change and life catches up.
3. Event-Specific Resilience
Data from track and field shows that this "square curve" applies differently depending on your sport. While running speeds eventually drift downwards before coming to a cliff edge, throwing and jumping events (power outputs requiring more muscular function) often show a continuous linear decline [9]. The decline is not a universal physiological failure; it is specific to the systems you stop stressing and challenging.
The Real Driver of Decline: The "Volume Gap"
If the biology supports high performance until 70, the big question is why do so many people slow down at 50?
The population level data most likely reflects reduced training volume, not a ceiling of cellular ageing.
As we age, career peaks, family obligations, and minor injuries conspire to lower our weekly training hours.
If you reduce training volume by 40% because you are "getting older," your performance will drop.
If you attribute that drop to "ageing" rather than "detraining," you create a self-fulfilling prophecy.
The "linear decline" seen in the FRIEND registry may just represent a graph of people doing less activity or training over time.
How to Square the Curve?
1. Defend Your Volume
The hardest metric to maintain as a high-functioning professional is time. However, volume is the signal that tells your body to keep capacity online.
Strategy: If you cannot train long during the week, you must maintain frequency. A short stimulus every day is often better than a "weekend warrior" approach that may be more likely to lead to injury.
2. Intensity is the "Anti-Ageing" Signal
Volume maintains the base and pushes up the ceiling; intensity “pulls up” the ceiling. To counteract the natural drift in VO2 peak, you must push the tip of the pyramid higher.
Strategy: Never let a week go by without getting into your top-end gears (sprint speed, heavy lift, or Zone 5 heart rate), even if just for small doses (VILPA).
3. Treat Injury as a priority
In your 30s, you could train through a niggle. In your 60s, a niggle that forces you to stop training for 3 months creates a "fitness deficit" that is very hard to recover.
Strategy: Be aggressive with pre-hab. If you feel a tweak, modify training immediately to keep moving without pain. Continuity is the secret to volume.
Summary
The "inevitable" slide from age 30 might not be so inevitable. While your physiological ceiling VO2 peak may drift lower, your ability to perform does not have to follow the same slope. By maintaining high training volumes and improving efficiency, you can compress morbidity and square the curve so that you remain athletic, capable, and high-performing well into your 70s.
The cliff exists, but it is much further away than you have been told.
Q and A
Q: Does physical decline really start at 30?
A: Average population curves often look like that because many people reduce activity over decades. The masters athlete and senior competition data suggests a different pattern in people who keep training and keep competing. In that group, performance can stay relatively stable into the 60s and early 70s before decline accelerates. [7] [8]
Q: Is VO2 peak really a better predictor of mortality than classic risk factors?
A: Cardiorespiratory fitness consistently predicts outcomes strongly in large datasets and is now framed as a clinical vital sign by the American Heart Association. [1] In treadmill testing cohorts, lower fitness tracks with markedly higher long term mortality risk, even after adjustment for other factors. [2]
Q: Should I care about VO2 peak if I am not an endurance athlete?
A: Yes. The strongest benefit often comes from moving out of the lowest fitness band, not from chasing elite numbers. Even small improvements associate with meaningful reductions in all cause mortality risk in observational data. [3]
Treat it as a systems marker. It reflects cardiac output, pulmonary capacity, blood volume, muscle oxidative capacity, and training consistency.
Q: VO2 peak declines with age even in athletes, so what is the point?
A: Because performance is not only dictated by the ceiling. Masters data suggests VO2 peak and maximal heart rate drift down with age, even in trained people. [4] But performance can remain stable for longer than the physiology curve implies, likely through improved economy and the ability to sustain a higher fraction of your maximum. [6]
This is not a free pass. It is a reminder that ageing is not a single lever.
Q: How can marathon performance stay stable if VO2 peak falls?
A: Two big reasons.
First, efficiency: you can use less oxygen for the same pace.
Second, durability: you can hold a higher percentage of your maximum for longer.
Also, selection matters. Studies of race results overrepresent people who stay healthy enough to keep racing. That can flatten the curve compared with the general population. [7]
Q: What is the simplest training principle to protect the “plateau”?
A: Protect volume first, then add small doses of high intensity. The masters and senior data supports the idea that maintaining training exposure is what keeps performance stable, more than any single hack. [6] [7]
This does not mean maximal sessions every week. But it does mean you should avoid long gaps, because detraining can mimic “ageing” fast.
Q: Does this apply equally to strength and power?
A: Not automatically. Track and field analyses suggest endurance style performance can stay flatter for longer, while power dependent events show a more linear decline. [9]
So you need to train the system you want to preserve. If you stop loading muscle and tendon heavily, you should expect strength and power to drift.
Q: What changes after 75?
A: Senior Olympic data suggests an inflection where performance decline accelerates after the mid 70s. [8] That likely reflects a mix of biology, injury burden, comorbidity, and reduced training tolerance.
The practical implication is timing. Build and maintain capacity earlier, so you enter that decade with more reserve.
Q: How should I measure VO2 peak properly?
A: Use cardiopulmonary exercise testing if you want a true VO2 peak. Mode and protocol matter. Bike values often differ from treadmill values, and ramp rate can shift the peak achieved. Use the same modality and similar protocol when you want to track change over time. The FRIEND Registry paper provides reference standards based on CPET. [5]
Q: Am I too old to improve VO2 peak meaningfully?
A: No. Training adaptations still occur with age, although the stimulus required may be higher and recovery may take longer. Longitudinal data in masters athletes shows change over time rather than a fixed ceiling. [4]
The more important question is not “can I improve,” but “what is the smallest training dose I can sustain for years.”
Further Reading
[1] R. Ross et al., ‘Importance of Assessing Cardiorespiratory Fitness in Clinical Practice: A Case for Fitness as a Clinical Vital Sign: A Scientific Statement From the American Heart Association’, Circulation, vol. 134, no. 24, pp. e653–e699, Dec. 2016, doi: 10.1161/CIR.0000000000000461.
[2] K. Mandsager, S. Harb, P. Cremer, D. Phelan, S. E. Nissen, and W. Jaber, ‘Association of Cardiorespiratory Fitness With Long-term Mortality Among Adults Undergoing Exercise Treadmill Testing’, JAMA Netw. Open, vol. 1, no. 6, p. e183605, Oct. 2018, doi: 10.1001/jamanetworkopen.2018.3605.
[3] G. A. Gaesser and S. S. Angadi, ‘Obesity treatment: Weight loss versus increasing fitness and physical activity for reducing health risks’, iScience, vol. 24, no. 10, p. 102995, Sep. 2021, doi: 10.1016/j.isci.2021.102995.
[4] S. A. Hawkins, T. J. Marcell, S. Victoria Jaque, and R. A. Wiswell, ‘A longitudinal assessment of change in V̇O2max and maximal heart rate in master athletes’, Med. Sci. Sports Exerc., vol. 33, no. 10, p. 1744, Oct. 2001.
[5] ‘Reference Standards for Cardiorespiratory Fitness Measured With Cardiopulmonary Exercise Testing - Mayo Clinic Proceedings’. Accessed: Feb. 01, 2026. [Online]. Available: https://www.mayoclinicproceedings.org/article/S0025-6196(15)00642-4/fulltext
[6] V. J. Wright and B. C. Perricelli, ‘Age-Related Rates of Decline in Performance among Elite Senior Athletes’, Am. J. Sports Med., vol. 36, no. 3, pp. 443–450, Mar. 2008, doi: 10.1177/0363546507309673.
[7] D. Leyk et al., ‘Age-related Changes in Marathon and Half-Marathon Performances’, Int. J. Sports Med., vol. 28, no. 06, pp. 513–517, Jun. 2007, doi: 10.1055/s-2006-924658.
[8] ‘Age-Related Rates of Decline in Performance among Elite Senior Athletes - Vonda J. Wright, Brett C. Perricelli, 2008’. Accessed: Feb. 05, 2026. [Online]. Available: https://journals.sagepub.com/doi/10.1177/0363546507309673
[9] B. Ganse, U. Ganse, J. Dahl, and H. Degens, ‘Linear Decrease in Athletic Performance During the Human Life Span’, Front. Physiol., vol. 9, Aug. 2018, doi: 10.3389/fphys.2018.01100.